Domestic Adoption Statistics

Hoping to Adopt a Baby? Adoption Statistics to Know
The first modern adoption law, the Adoption of Children Act, was passed in Massachusetts in 1851. It was the first to focus on what really mattered: the best interests of children. Since then, adoption has grown tremendously. In the United States, one in 35 children is adopted, and more than 50,000 children are adopted through foster care adoption every year. Its estimated more than 100,000 children are adopted through all adoption methods every year in the United States.
General Adoption Statistics
About Private Domestic Adoption
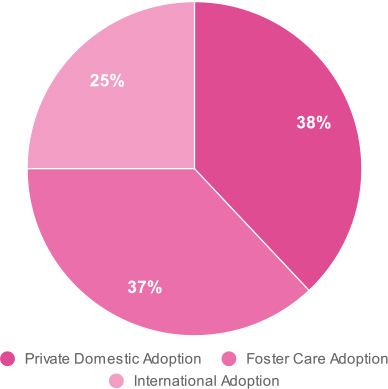
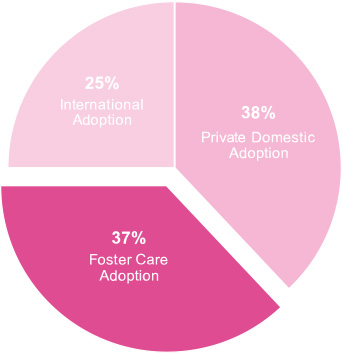
Private Domestic Adoption: 38%
Foster Care Adoption: 37%
International Adoption: 25%
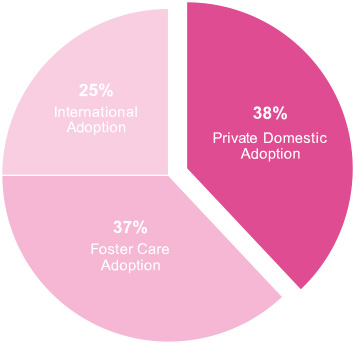
Despite longer wait times and potentially higher costs, private domestic adoption is the most popular kind of adoption in the United States. Of children who were adopted privately in the United States, 62% were younger than one month old. Most families have open adoption agreements of some kind and have had post-adoption contact with their childs birth families. According to some indicators, families who adopt privately may be more satisfied than families who adopt via foster care or international adoption.
Adoption statistics specifically representing just private domestic adoption and excluding foster care and international adoptions are difficult to locate. Private adoption data are not usually compiled or even published publicly. The following statistics are from the U.S. Department of Health and Human Services 2008 National Survey of Adoptive Parents (NSAP), and are some of the only data that represent private adoption statistics in the United States without including step-parent adoptions. The findings represent children under age 18 who were adopted and living with neither biological parent.
About Children Adopted via Private Domestic Adoption
Gender
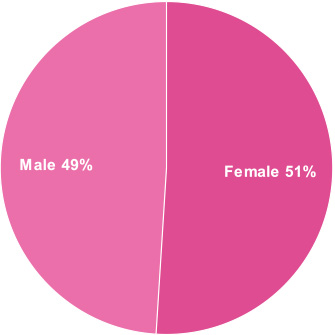
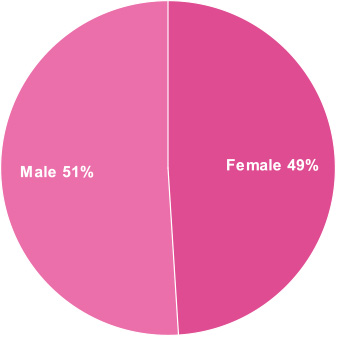
- Male: 51%
- Female: 49%
Age
Of all children adopted privately in the United States, 62% were placed with their adoptive family as newborns or when they were younger than one month old, compared to 32% of all adopted children.
Race/Ethnicity
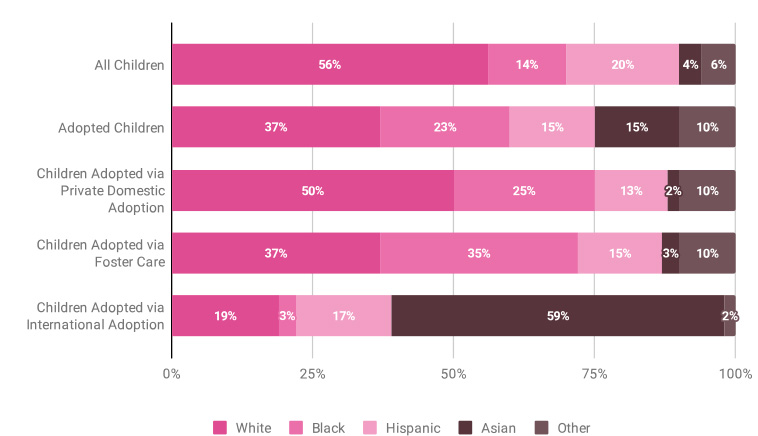
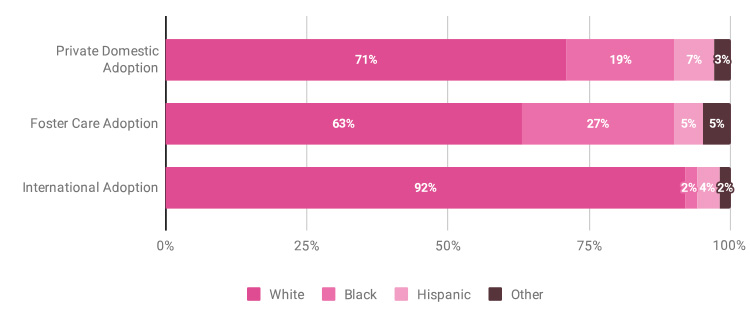
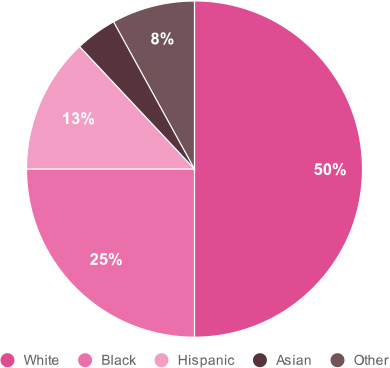
Children adopted privately from the United States are most likely to be white.
- White: 50%
- Black: 25%
- Hispanic: 13%
- Asian: 4%
- Other: 8%
Birth Family
Of all children in non-relative private domestic adoptions, 68% have had post-adoption contact with their birth families, compared to 36% of all non-relative adopted children on average. In addition, 67% have a pre-adoption openness agreement.
About Families who Adopted via Domestic Private Adoption
- Of children who were adopted privately, 37% were adopted by relatives, compared to 17% of children adopted from foster care, and very few of those adopted internationally.
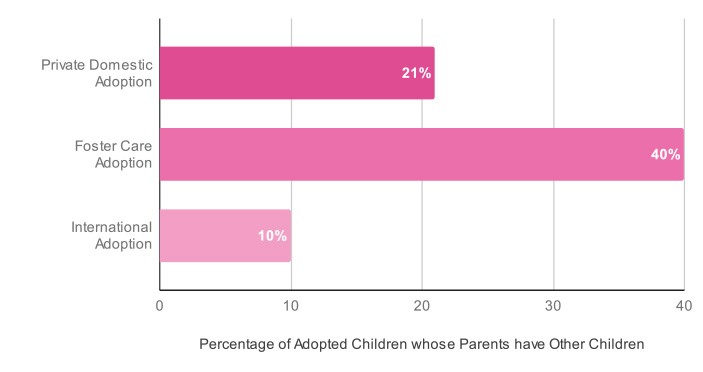
- Privately adopted children are more likely than other adopted children to be the only child in the household.
- Children adopted privately are more than twice as likely to have retired parents and are less likely to have married parents than other adopted children.
Adoption Satisfaction
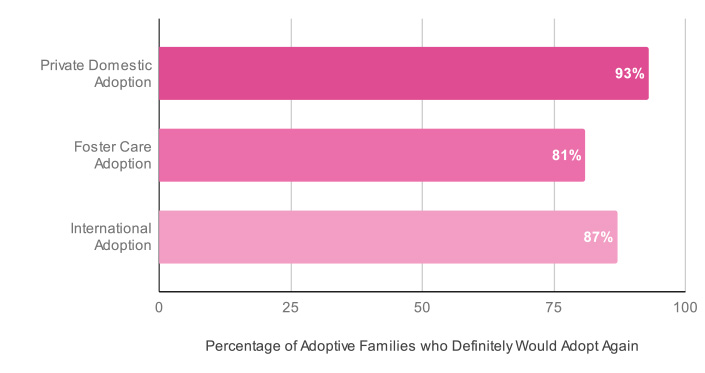
Of all parents who adopted privately, 93% said they definitely would make the same decision to adopt again, the highest level of satisfaction among the three adoption types.
Percentage of Adoptive Families who Definitely Would Adopt Again
- Private Domestic Adoption: 93%
- Foster Care Adoption: 81%
- International Adoption: 87%
About Foster Care Adoption
Private Domestic Adoption: 38%
Foster Care Adoption: 37%
International Adoption: 25%
There are more than 400,000 children in the foster care system, and more than 100,000 of those children are waiting to be adopted. Of all children entering foster care in 2020, 20% were infants. Infants accounted for over 70% of the total increase in foster care entries from 2011 to 2018. All children in the foster care system were removed from their familys care by child protective services due to the threat or evidence of violence, abuse, neglect, drug use, abandonment, or other dangers.
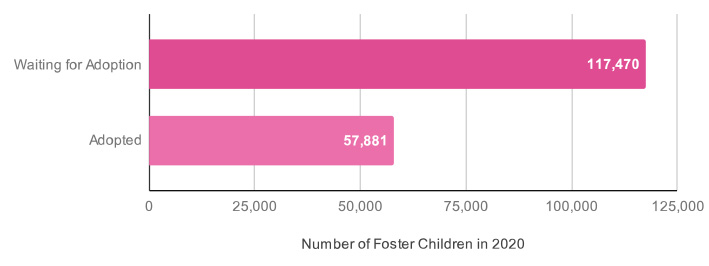
About Foster Children Waiting for Adoption vs Foster Children Adopted in 2020
Number
- Waiting for Adoption: 117.470
- Adopted: 57,881
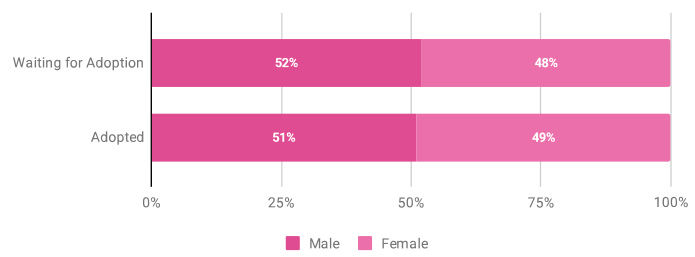
Gender
Foster Children Waiting for Adoption
- Male: 52%
- Female: 48%
Foster Children Adopted
- Male: 51%
- Female: 49%
Age
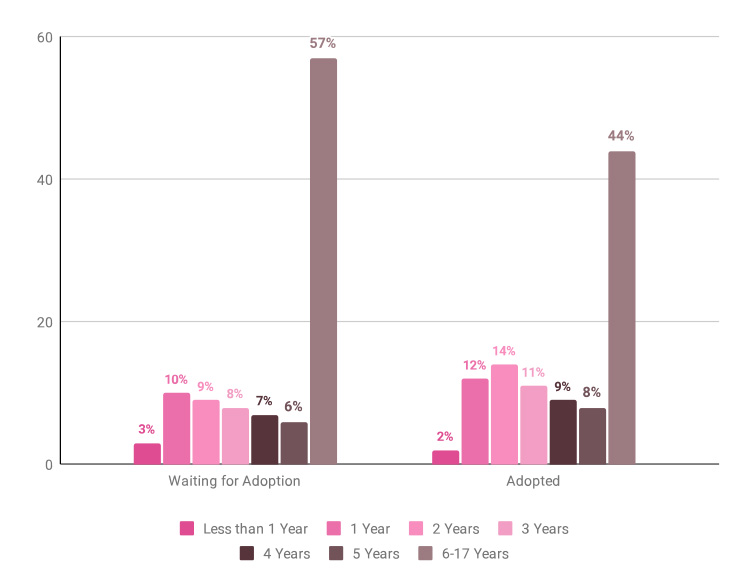
Foster Children Waiting for Adoption
- Less than 1 Year: 3%
- 1 Year: 10%
- 2 Years: 9%
- 3 years: 8%
- 4 Years: 7%
- 5 Years: 6%
- 6-17 Years: 57%
Foster Children Adopted
- Less than 1 Year: 2%
- 1 Year: 12%
- 2 Years: 14%
- 3 years: 11%
- 4 Years: 9%
- 5 Years: 8%
- 6-17 Years: 44%
Race/Ethnicity
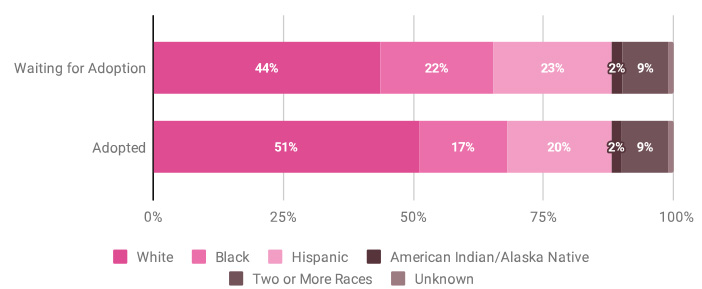
Children in and adopted from foster care are less likely to be white than children in the general U.S. population. Minority children, especially black children, are disproportionately involved in all stages of child welfare services.
Foster Children Waiting for Adoption
- White: 44%
- Black: 22%
- Hispanic: 23%
- American Indian/Alaska Native: 2%
- Two or More Races: 9%
- Unknown: 1%
Foster Children Adopted
- White: 51%
- Black: 17%
- Hispanic: 20%
- American Indian/Alaska Native: 2%
- Two or More Races: 9%
- Unknown: 1%
Adoptive Family Structure
Family Type
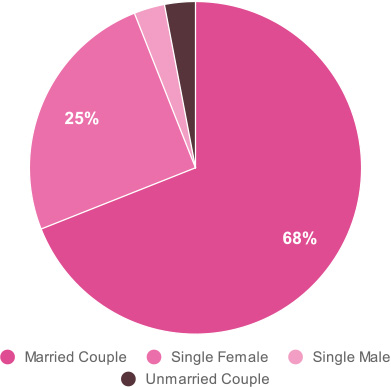
Most children adopted from foster care are adopted by married couples or single females.
Type of Family Foster Care Children Adopted Into
- Married Couple: 68%
- Single Female: 25%
- Single Male: 3%
- Unmarried Couple: 3%
About International Adoption
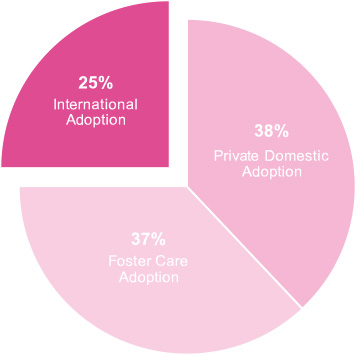
Private Domestic Adoption: 38%
Foster Care Adoption: 37%
International Adoption: 25%
Given our constantly shifting political landscape and dynamic international adoption laws, statistics concerning international adoption are always changing. It is not uncommon for the main countries of origin for internationally adopted children to change drastically from year to year.
In 2020, there were 1,622 international adoptions in the United States from 67 different countries, a 45% decline from 2019. This can be largely attributed to the impact of the global pandemic on worldwide government operations and travel, and is a very significant decline from the United States all-time high of 22,989 adoptions in 2004.
Over the past decade, the number of children adopted through international adoption has declined on a global basis. Some reasons for this include improved economic conditions, greater acceptance of domestic adoptions, more stringent adoption requirements by some countries, and political reasons. Although international adoption comprised 25% of all U.S. adoptions in 2007, that percentage has likely dropped to below 5% for 2020 adoptions.
Trend statistics listed below are from the 2008 National Survey of Adoptive Parents (NSAP), and more recent numbers reflect data from the U.S. Department of State 2020 Annual Report on Intercountry Adoption. These numbers reflect adoptions from October 1st, 2019, through September 30th, 2020, and were impacted by the COVID-19 pandemic, as travel restrictions made the international adoption process very difficult, if not impossible.
About Children Adopted via International Adoption
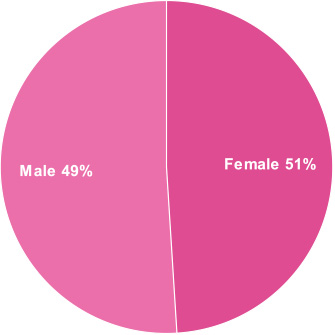
Gender
- Male: 49%
- Female: 51%
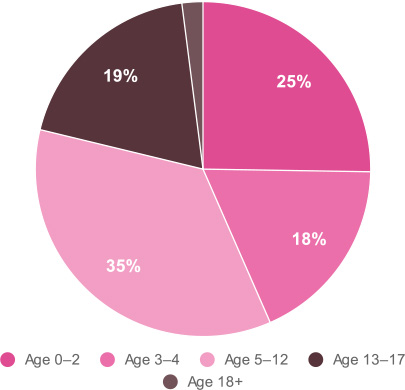
Age
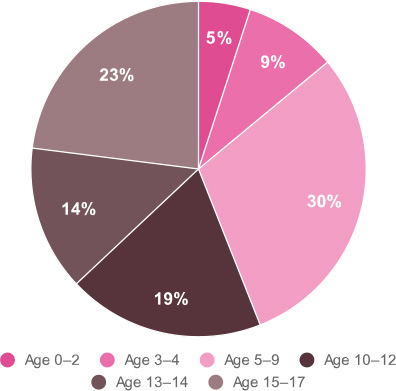
- Age 0-2: 25%
- Age 3-4: 18%
- Age 5-12: 35%
- Age 13-17: 19%
- Age 18+: 2%
Race/Ethnicity
- White: 25%
- Black: 3%
- Hispanic: 17%
- Asian: 59%
- Other: 2%
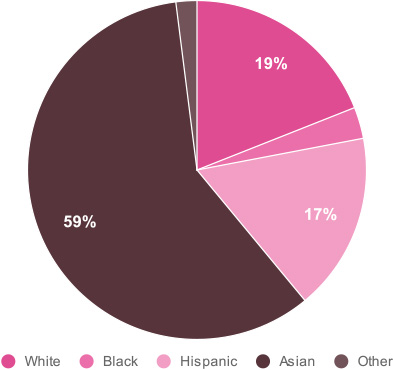
The majority of children adopted internationally are Asian. In comparison, very few children adopted from foster care or through private domestic adoptions are Asian; in fact, the proportion is often so small that reliable estimates can not be generated.
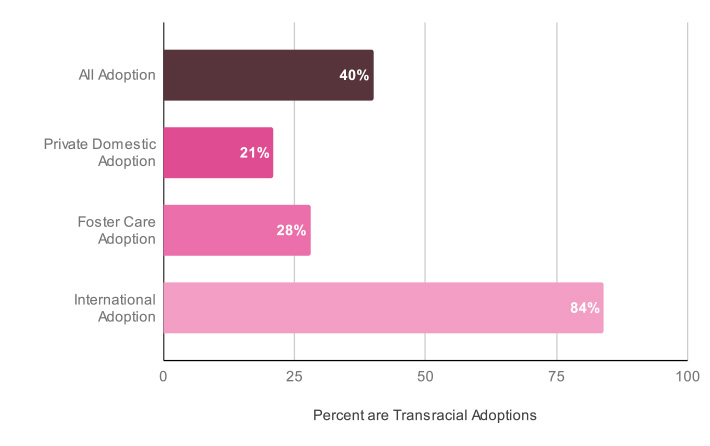
Of all children adopted internationally, 92% were adopted by non-Hispanic white families. Of all international adoptions, 84% are considered transracial placements, compared with 28% of children adopted from foster care and 21% of those adopted privately.
About Families who Adopted via Domestic Private Adoption
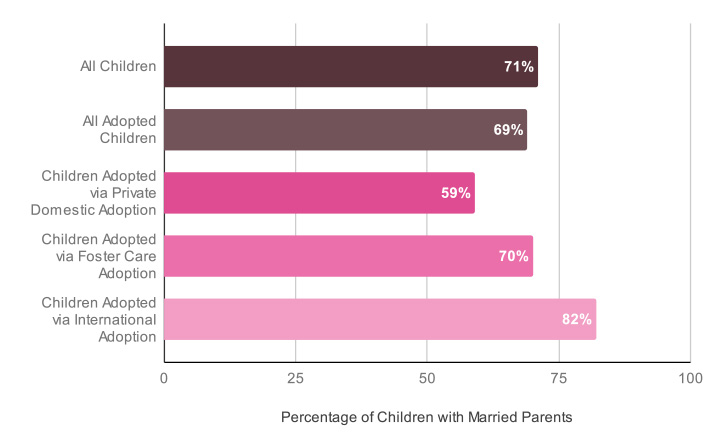
Married Parents
Children adopted internationally are more likely to have married parents than other adopted children.
Percentage of Children with Married Parents
- All Children: 71%
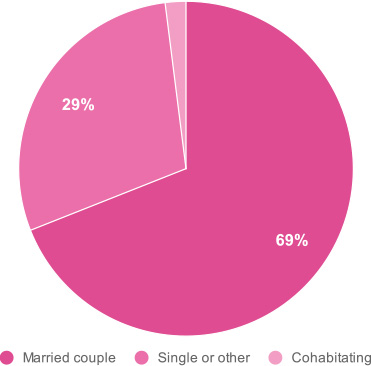
- All Adopted Children: 69%
- Children Adopted via Private Domestic Adoption: 59%
- Children Adopted via Foster Care Adoption: 70%
- Children Adopted via International Adoption: 82%
Education Level and Income
Compared to parents of children adopted from domestic sources, parents of internationally adopted children are more likely to have education beyond high school, to have incomes exceeding four times the federal poverty threshold, and to work full time.
Private Domestic Adoption
- Parent Education is Beyond High School: 79%
- Household Income is Greater than 400% above the Poverty Threshold: 33%
- Parents are Employed Full-time: 31%
Foster Care Adoption
- Parent Education is Beyond High School: 70%
- Household Income is Greater than 400% above the Poverty Threshold: 25%
- Parents are Employed Full-time: 31%
International Adoption
- Parent Education is Beyond High School: 95%
- Household Income is Greater than 400% above the Poverty Threshold: 58%
- Parents are Employed Full-time: 43%

Reasons for Adoption
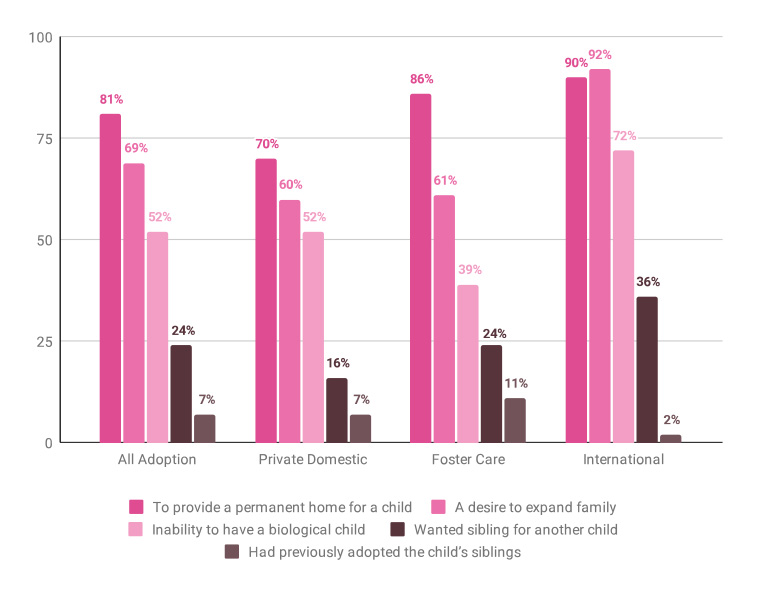
When compared to parents of other adoption types, parents of internationally adopted children were more likely to be motivated to adopt by a desire to expand their family, struggling with infertility, or a desire for a sibling for their child.
All Adoption
- To provide a permanent home for a child: 81%
- A desire to expand family: 69%
- Inability to have a biological child: 52%
- Wanted sibling for another child: 24%
- Had previously adopted the childs siblings: 7%
Private Domestic Adoption
- To provide a permanent home for a child: 70%
- A desire to expand family: 60%
- Inability to have a biological child: 52%
- Wanted sibling for another child: 16%
- Had previously adopted the childs siblings: 7%
Foster Care Adoption
- To provide a permanent home for a child: 86%
- A desire to expand family: 61%
- Inability to have a biological child: 39%
- Wanted sibling for another child: 24%
- Had previously adopted the childs siblings: 11%
International Adoption
- To provide a permanent home for a child: 90%
- A desire to expand family: 92%
- Inability to have a biological child: 72%
- Wanted sibling for another child: 36%
- Had previously adopted the childs siblings: 2%
About Adoption Statistics and Sources
Finding adoption facts and figures that are representative of all methods of adoption (international, public, and private) across the United States is difficult. Public adoption statistics are gathered every year by the U.S. Department of Health and Human Services Office of the Administration for Children & Families through the Adoption and Foster Care Analysis and Reporting System (AFCARS), and international adoption statistics are published annually by the U.S. Department of State in their Annual Report on Intercountry Adoption; however, private domestic adoption data are not usually compiled or even published publicly. There is no single source for the total number of children adopted in the United States, and, even when multiple sources are used, domestic adoption data from private agencies are often not included.
However, during 2007 to 2008, the U.S. Department of Health and Human Services conducted the National Survey of Adoptive Parents (NSAP), the first extensive national study to be conducted for the sole purpose of gathering empirical data about adoption. This study provided some of the only data that represent compiled public, private, and international adoption statistics. The survey provides the most comprehensive overview of adoptions, although other sources, such as the American Community Survey (ACS), 2010 U.S. Census, and National Council For Adoption (NCFA), provide a few updated numbers and statistics.
Above are some figures and statistics gathered based on the 2008 NSAP findings representing all adoptions in the United States, the 2021 report on AFCARS data representing all public adoptions in 2020, NSAP findings representing all private adoptions, and NSAP, ACS, and U.S. Department of State data representing all international adoptions.
Sources
U.S. Department of Health and Human Services, Administration for Children and Families. Adoption and Foster Care Analysis and Reporting System (AFCARS) FY2020 data. The Administration for Children and Families, 19 November 2021, //www.acf.hhs.gov/sites/default/files/documents/cb/afcarsreport28.pdf.
Taylor, Danielle. Fifteen Percent of Same-Sex Couples Have Children in Their Household. U.S. Census Bureau, 17 September 2020, //www.census.gov/library/stories/2020/09/fifteen-percent-of-same-sex-couples-have-children-in-their-household.html.
Crouse, Gilbert, et al. Foster Care Entry Rates Grew Faster for Infants than for Children of Other Ages, 2011-2018. HHS ASPE, 17 August 2021, //aspe.hhs.gov/reports/foster-care-entry-rates-2011-2018.
Anderson, Lydia, et al. Living Arrangements of Children: 2019. Census Bureau, February 2022, //www.census.gov/content/dam/Census/library/publications/2022/demo/p70-174.pdf.
Lofquist, Daphne A. and Rose M. Adopted Children and Stepchildren: 2010. U.S. Census Bureau, Population Characteristics, Washington, DC, 2014, P20-572, //www.census.gov/content/dam/Census/library/publications/2014/demo/p20-572.pdf.
U.S. Department of Health and Human Services, Administration for Children & Families. National Survey of Adoptive Parents (NSAP) | ASPE. HHS ASPE, 2008, //aspe.hhs.gov/national-survey-adoptive-parents-nsap.
Gates, G. LGBT Parenting in the United States. Williams Institute, UCLA School of Law, 2013, //williamsinstitute.law.ucla.edu/publications/lgbt-parenting-us/.
U.S. Department of Health and Human Services, Administration for Children & Families. Trends in Foster Care & Adoption: FY 2011- 2020. The Administration for Children and Families, 30 November 2021, //www.acf.hhs.gov/cb/report/trends-foster-care-adoption.
U.S. Department of State. 2020 Annual Report on Intercountry Adoption. Travel.State.Gov, July 2021, //travel.state.gov/content/dam/NEWadoptionassets/pdfs/FY%202020%20Annual%20Report%20(V2.1).pdf.
Please note that the information on these pages is for educational purposes only and is not intended to be a substitute for professional legal advice. Although we update the content on these pages frequently and make every effort to ensure the information is as accurate as possible, information of this kind does change quickly; therefore, some information may be out-of-date and/or contain inaccuracies, omissions, or typographical errors.
Last updated: August 2022

